Steam allows users to buy more than digital copies of their favorite games. The Marketplace has cosmetics, in-game loot boxes, and many more ways to spend money. One of the popular picks is the Steam trading card.
These trading cards can be earned to an extent, but you can only complete a set by buying them from other Steam users. Not everyone knows how it works, but the process is actually quite simple. Keep on reading for the details.
How to Buy Trading Cards on Steam
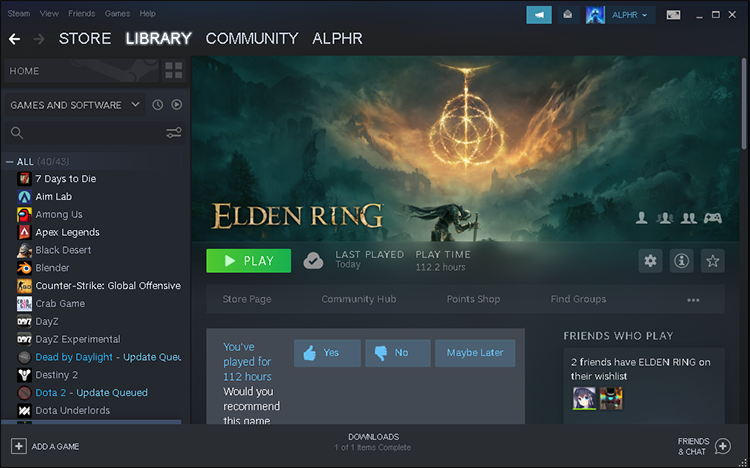
Trading cards are earned by users who play the games they purchased on Steam. For example, you can get a random one after playing a title like Elden Ring. After you play the game, the Steam window will have a green envelope icon, and you can click it to reveal your newest trading card.
The best part about earning trading cards is you don’t truly have to play the game. Even leaving the game idle on the menu for a long time counts.
Once you own the trading card, you can turn it into gems, save it in your inventory, or list it on the Marketplace for sale. The last option is automated after you put it up, and you’ll get a notification once someone buys it.
However, you will likely only get about half of a complete set by playing the game. If a game has 16 cards in the set, players can only earn eight of them by playing the game. Therefore, it’s impossible to complete the collection without paying. Not every game has a limit of 50%, as some have varying percentages.
Sadly, free-to-play games like Apex Legends and Yu-Gi-oh! Master Duel does support trading cards. The catch is you can only earn them after spending money on microtransactions. Every $9 or so will grant you one card drop.
DLC does not grant card drop opportunities either. Only a microtransaction in the game’s store counts for card drops.
To buy the remaining cards, you can follow these steps:
- Open the Steam window.
- On the right side of Community, click your Steam Name.

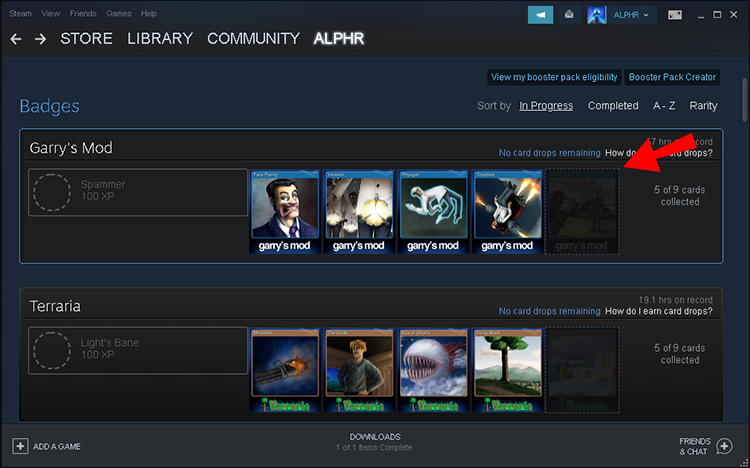
- Head to the “Badges” page.
- Pick the game you want to buy trading cards for.
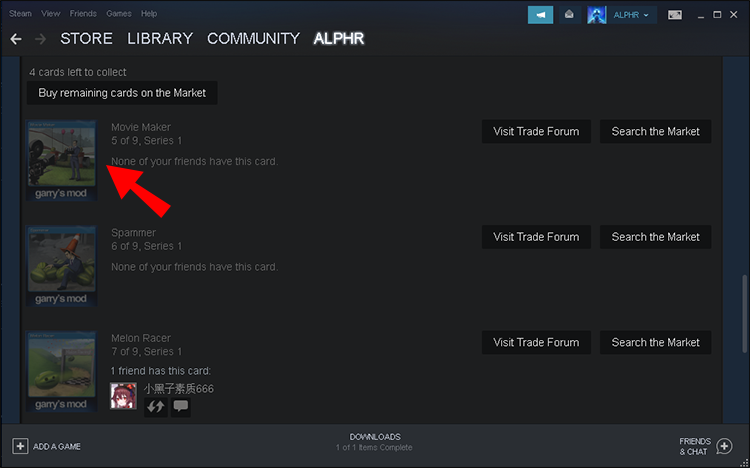
- Choose the card you want.
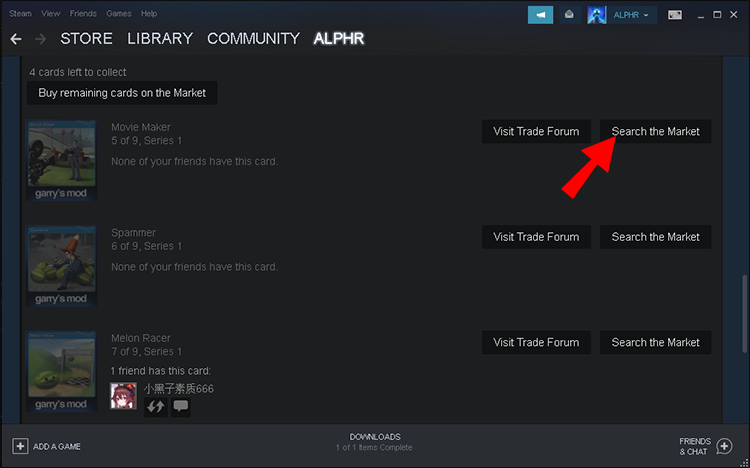
- Click on “Search The Market.”
- You can then buy any available choices.


Sometimes, rare cards don’t appear on the Steam Marketplace because few people play that game. In this case, your only option is to wait for the card to appear the next time you check.
Therefore, getting Steam trading cards for every game is different. It will depend on the game’s earning limits, price, and card availability.
How to Get R6 Trading Cards on Steam
Rainbow Six Siege is a tactical first-person shooter with its own eSport. Many players around the world enjoy playing the game.
There are 10 trading cards for Rainbow Six Siege, and you can earn five of them just by playing the game. The other five must be purchased from the Marketplace.
The process goes like this:
- Launch Steam on your PC.
- Head to the “Community” tab.
- Select “Market.”
- Navigate to “Badges.”
- Pick “Rainbow Six Siege.”
- Find any missing card you want.
- Click on the “Search The Market” option.
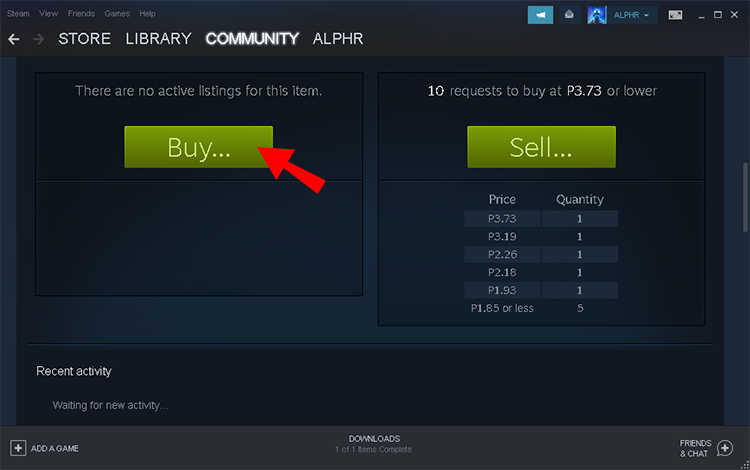
- Buy the cards at the price you want.


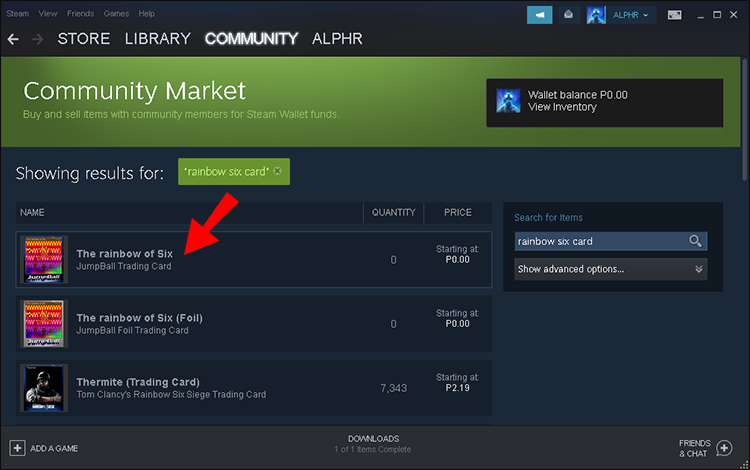

By checking this page, you can see that these cards generally cost a few cents, especially the non-foil versions. Even the foil cards themselves cost less than a quarter. The highest price so far is 19 cents for a Thermite Foil Trading Card.
These cards are incredibly cheap, so it’s well worth picking up the missing ones. Rainbow Six Siege has a large player base, so it’s safe to say that the cards will never be in short supply.
How to Get Rare Trading Cards on Steam
There are no “Rare Trading Cards,” but you may get Foil Trading Cards instead on occasion. Foil Trading Cards have a gleaming silver border instead of the standard blue border. They are obtained the same way as standard ones, but it’s all up to chance.
Naturally, foil cards are less likely to appear. Their prices are at least double a standard trading card. The good news is you can still buy them.
The first way to possibly get foil cards is to play the game. When you play the game long enough, the envelop icon will appear, and you can see if you got lucky with your card drop.
If not, it’s time to head to the Community Marketplace.
- Launch the Steam client on your PC.
- Head to the “Community” tab.
- Select “Market.”
- Navigate to “Badges.”
- Search a game you own that supports trading cards.
- Find the foil card you want.
- Click on the “Search The Market” option.
- Buy the foil card.


There may be some foil cards for sale that you want, depending on the game. However, you should also be prepared to find none, especially if you play a more obscure game.
Players who get all the card drops in a game may also receive a booster pack. It contains three random cards from the set. The exact formula for obtaining them isn’t clear, but Valve does incorporate a solution for those with bad luck, increasing their chances the longer they don’t get one.
Booster packs can also be purchased with Gems, and they can only be Gems from a single set. The packs may drop a foil card if you’re lucky.
How to Get Terraria Trading Cards on Steam
Terraria is a very old game that still enjoys a healthy player base. You have nine trading cards available, though you can only get four from playing the game. Like Rainbow Six Siege, Terraria has an ample supply of cards on the Marketplace, some numbering in the tens of thousands.
Buying the remaining five is done using these steps:
- Open the Steam client on your computer.
- Go to the “Community” tab.
- Pick “Market.”
- Head to “Badges.”
- Select “Terraria” from the list of games.
- Find any missing trading card you want.
- Click on the “Search The Market” option to check out the prices.
- Purchase the cards you want.
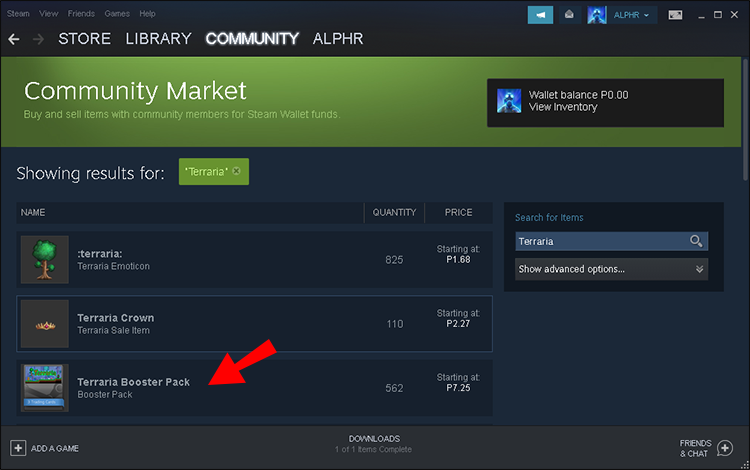


Even though there are many inexpensive standard trading cards, the foil cards cost more. There aren’t more than 200 of them as of writing time. They cost around $0.30.
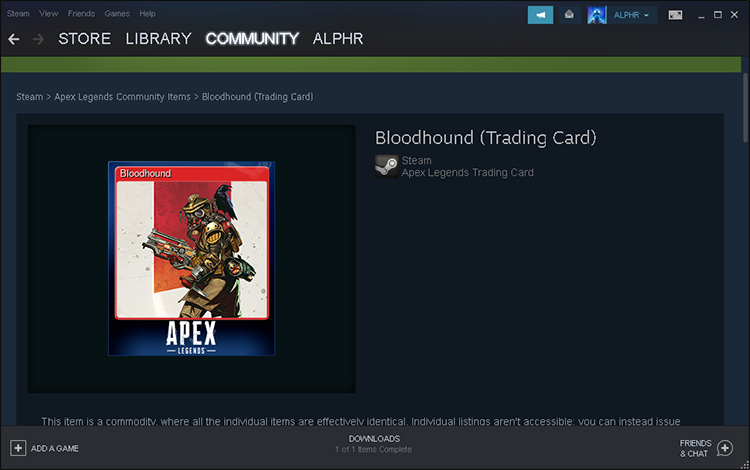
How to Get Apex Legends Trading Cards on Steam
Apex Legends is a free-to-play game, so you don’t get any card drops if you don’t spend money. However, you can still purchase the trading cards without any in-game microtransactions. There are eight cards in the set, and you have four chances to get them.
- Launch the Steam client on your computer.
- On the right side of Community, click your Steam Name.
- Go to “Badges.”
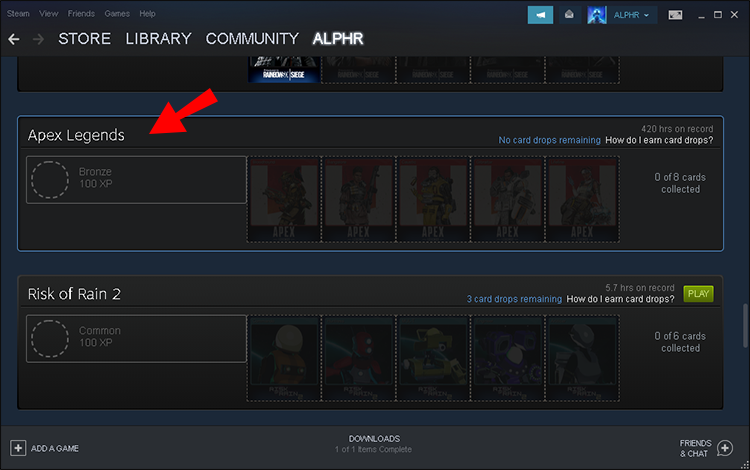
- Find “Apex Legends” from the list of games.
- Locate a missing trading card you want.
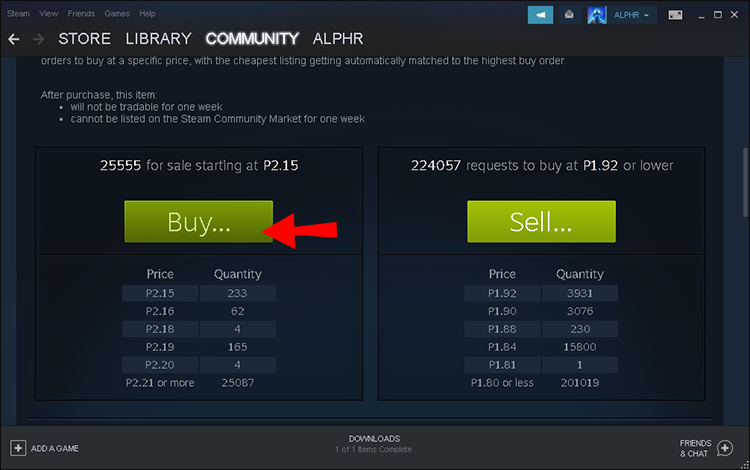
- Click on the “Search The Market” option.
- Purchase the card.
- Repeat as needed.


While Apex Legends is a free game, some players enjoy buying cosmetics and spend money in-game for loot boxes. Therefore, they might get extra card drops they don’t want.
The prices range from less than 10 cents to almost a dollar, especially for foil cards.
Spending the minimum amount on Apex Coins ($9.99) should grant you one chance at receiving a drop. Therefore, it’s possible to be a small spender in Apex Legends for the sake of earning cards.
A Fine Addition
Fortunately, the Steam Marketplace seems to have many trading cards that you can buy within a dollar. Foil cards cost much more, but those are typically for hardcore collectors only. If you want to buy trading cards, the Community Marketplace is the best place to look for them.
How many sets have you completed on Steam? Have you ever earned a foil card? Let us know in the comments section below.


Disclaimer: Some pages on this site may include an affiliate link. This does not effect our editorial in any way.

