Introduced during Apex Legends season 2, the ranked ladder is a place for players to test their abilities in competitive matches against similarly skilled opponents. The ranked queue has a few notable differences from the regular game queues. Newer players are encouraged to hone their gunplay, learn the maps, and get knowledgeable about all the game elements before dropping into the world of ranked games.
If you think you’re ready to play Ranked in Apex Legends, here is the breakdown of what you need to know to get started.
How Does Ranked Apex Legends Work?
The overall gameplay of Ranked matches doesn’t differ much from standard Trios game mode. You can queue up by yourself or up to two other players in a party and play on a map against 19 other teams (typically). However, that’s where the similarities end.
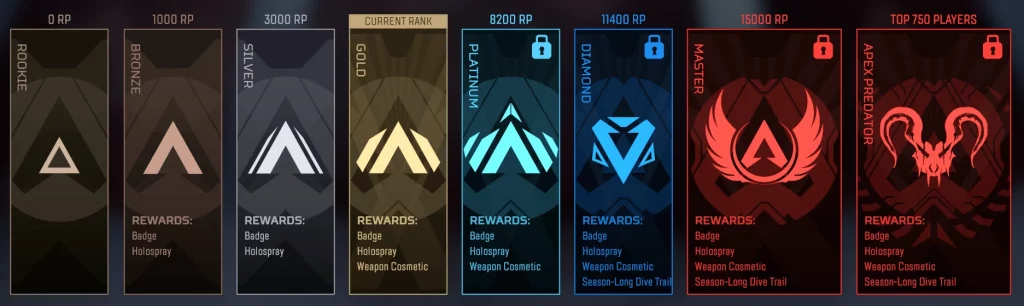
All players are sorted into tiers in the ranked queue based on their acquired RP (ranked points). There are a total of eight tiers: Rookie, Bronze, Silver, Gold, Platinum, Diamond, Master, and Apex Predator. The first five tiers have four divisions each, with division four being the lowest in each tier. Apex Predator is a specific tier, counting only the top 750 players per platform. Here is the RP requirement for division IV of each tier (or Master):
- Rookie: 0 RP

- Bronze: 1000 RP
- Silver: 3000 RP
- Gold: 5400 RP
- Platinum: 8200 RP
- Diamond: 11400 RP
- Master: 15000 RP
- Apex Predator: top 750 players with over 15000 RP


Players are typically matched with opponents in the same rank. For parties, the highest tier achieved is considered for placing the party. When queuing together, players above Platinum can’t queue with players two tiers below them. That means that Platinum players can only play with Diamond and Gold players in the ranked queue.
How to Earn or Lose RP?
Whenever you start a match, you lose some RP based on your current tier. Players in Rookie don’t lose any RP for playing the game, allowing them to rank up with enough games played, slowly. For all other tiers, the amount of RP lost at the beginning of the match is as follows:
- Rookie: 0 RP
- Bronze: 10-19 RP
- Silver: 22-31 RP
- Gold: 34-43 RP
- Platinum: 46-55 RP
- Diamond: 58-67 RP
- Master and Apex Predator: 70 RP, +5 for every 1000RP earned, maxing out at 175
This RP loss can’t force you to go down a tier. That effectively means that if you reach Platinum, for example, in ranked split, you can’t drop down to Gold for that split. Players can drop divisions if they lose enough RP to go below the division cutoff. Apex Predators players can also lose their status if they stop being in the top 750, according to their RP.
Players can get RP in the game in two ways. The first is to be one of the top 13 teams standing. The closer you get to the top standing; the more RP you gain. The maximum RP amount gained this way is 100 if you’re the match winner.

The other way to earn RP is to get kills or assists. A kill is straightforward. All you have to do is land the final shot on an opponent that takes them down. Dealing damage to an opponent that someone else kills, at most 10 seconds later, counts as an assist. Crypto can also get assists by locating enemies with his drone. Each kill or assist will give you RP, up to a cap of six takedowns per match. The amount players receive per kill is based on their team standing at the end of the match, from 10 RP if you’re below 10th place up to 25 for winning. All RP gains are calculated after the game ends for your team.
The RP gains mean that the match winner will receive up to 250 RP if they score at least six takedowns during the match, reduced by the entry cost of their current tier.
Due to the increasing RP costs of joining the match and progressively higher requirements for reaching higher divisions and tiers, players near the top of the ladder need to have a high kill/death ratio and survive long in their matches if they want to climb through the tiers.
Abandonment and Penalties
Unlike regular games, the ranked queue puts heavy emphasis on players staying until the last possible moment. To that end, abandoning the game while your teammates still have a chance to revive you will lock you out of playing any game queue. The penalty starts at 10 minutes for the first infraction and increases for subsequent abandons in a short span. Players can safely leave the game if 150 seconds pass after teammates have picked up their banner but haven’t respawned them or if their banner timer runs out.

Abandoning the game also forfeits any RP you would’ve gained for that match.
If a player disconnects from the game before the dropship phase starts, their assigned (matchmade) teammates can leave the game without the associated leaver penalty or the RP loss for joining a match. Members in the party with the player who disconnected will get penalized with an “abandon.”
Ranked Rewards
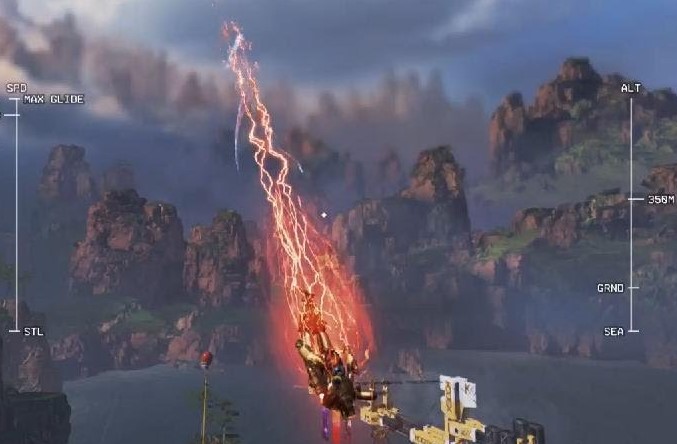
At the end of each ranked season, players get rewards based on their highest tier achieved during any two splits in the season. All players get a badge noting their highest achieved tier. Gold and above players get a special charm to commemorate their standing. Diamond and above players get a special dive trail to use during the following season. The dive trail is colored according to the tier reached and visible to all players when the owner leaves the dropship.
Additional FAQ
Why do I keep losing my Apex predator rank?
Since Apex Predators must be in the top 750 players on their platform, they can lose their tier if someone else gets more total RP. Finishing games without getting a lot of RP also puts you at risk of slowly losing ranks due to the prohibitive 60 RP cost to enter each match.
What is the fastest way to rank up in Apex Legends?
There’s no tried-and-true formula to rank up quickly. Since RP gains are connected to your kill participation and survival, you need to get a mix of both if you want to rank up. Some players prefer to drop with plenty of other people around and try to get some early kills and snowball their lead. For others, getting decent loot and information is preferable.
A surefire way to get some RP is to avoid fights at all costs and wait to get the top spots. This method is slow if people don’t eliminate each other quickly, and you miss out on a decent chunk of RP from takedowns, but it is one of the most straightforward and reliable methods to net some RP each game.
What is a good rank in Apex Legends?
According to season 13 statistics, 17.44% of players are in Silver and Bronze, another 41.50% in Gold, and 32.57% are in Platinum. Diamond and above players make up only 8.5% of the player base.
Generally speaking, getting to Gold shouldn’t be too difficult if you have the time to improve on some of the basic skills and keep winning more RP than you’re losing. Players in Master make up only 0.45% of the player base, making it the ultimate goal for a competitive player but unattainable for most people.
How does the ranked split work?
Un-ranked matches rotate two maps every few hours to diversify gameplay and allow players to enjoy more options during their games. Ranked games, however, use a single map for all matches for half of each season, called a split. Ranked splits occur roughly halfway through a ranked season. All players get their RP partially reset when a split happens, which drops every players rank by 1.5 tiers. This is a good way to push inactive players down the tier list and allow new talent to rise among the ranks.
When a ranked split happens, the active map changes for the remainder of that ranked season.
Rank Up in Apex Legends
If you think you’ve got what it takes to be a top Apex Legends player, you’ll need to test your mettle in the game’s ranked queue. The matchmaker will pit you against opponents of a similar skill level, and it’s up to you (and your two teammates) to get some takedowns, survive, and get some RP in the process.
What is your top rank in Apex Legends? Leave a comment in the section below.
Related Posts
 How The Valorant Ranking System Works – Rankings Explained
 What Is a VPN? How It Works and Common Uses
 How Facebook Marketplace Shipping Works
 How Wireshark Works – A Simple Guide
 The Best VPN for League of Legends
 The Best VPN for Mobile Legends
 How to Change Your Work Outfit in The
Disclaimer: Some pages on this site may include an affiliate link. This does not effect our editorial in any way.